One of the most effective tools for teaching science is graphical or pictorial representations of the elements of the topic being taught, as in an anchor chart. Although some teachers don’t use them as they are supposed to because they don’t know how. So as someone new in the teaching world, there are lots of questions you may have about anchor charts, their importance, how to create them, and when to use them.
We’ve written this article to help you out. Also, free templates have been included for you to draw inspiration from and also use. We know that once you start using them, anchor charts will become one of your favourite teaching tools.
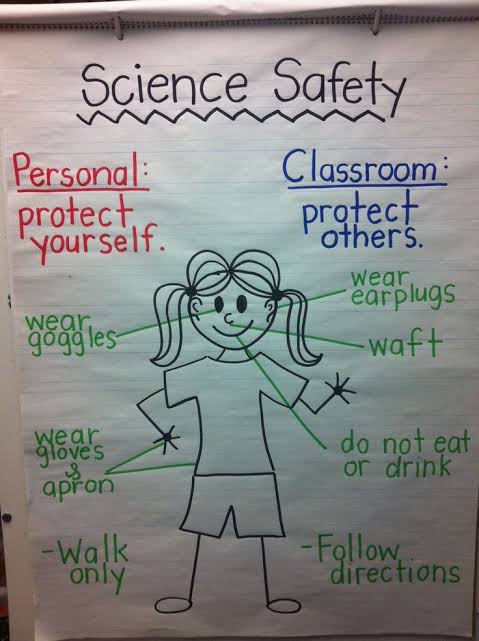
What is a Science Anchor Chart?
A science anchor chart is a tool used to support the teaching of science-related topics, which helps the students to have a full understanding of the topics. Anchor charts capture the key points of a topic that the students need to know.
Why are Science Anchor Charts Important?
Science anchor charts help the class become a learning environment. It does not only support the class aesthetic but the learning process as a whole. Take, for instance, a student in your class who s is struggling with a particular topic, they can easily refer back to the anchor charts, read them, understand them, and learn the topic. This way the class has become a learning environment for the students.
How to Create a Science Anchor Chart
Creating an anchor chart for your science class is not hard as you think. In fact, within 15-20 minutes you can create one.
Step 1
Get a chart or cardboard paper, I like the white-coloured ones because I can use different colours on them.
Step 2
Next is to design on paper, which you can do by either printing images from the internet and sticking them to the paper or you draw them yourself.
Step 3
Time to color. You’d want to make sure that you use bright and eye-catching colors. Also, use a marker board to write short notes on it.
Step 4
Here you can mask the edges with paper tape or not, it depends on you. Your anchor chart is ready to be used in the class.
Benefits of Using Anchor Charts in the Classroom
1. Bring lessons to life
Anchor charts help the students to understand what is taught in the classroom. For instance, the topic is on plants, you bring the lesson to life by drawing a flower and labelling its parts while you teach the students.
2. Support independent work
The students have a source to reference when working independently. This saves you from spending time going over topics multiple times.
3. Build a library of reference materials
They help students know what they are about to learn. For example, you’re to teach them the types of rock, you can create charts on the types of rock, how they are formed, and then post them on the board for them the students to see.
Helpful Tips
- Make sure your anchor charts are colorful.
- Keep them simple and neat.
- Draw simple objects to complement the short notes.
- Don’t overuse them.
- Don’t be afraid to borrow ideas from other teachers.
Anchor charts help teachers to engage with the students during science class. They make the class be fun and engaging, so make your class interesting by downloading these free templates here.
Share Post:
Eniola Makinde
Get our latest articles in your inbox. Sign up for email alerts.


[…] Your child’s environment plays a huge role in their learning process. This doesn’t necessarily mean you should have a special room for your homeschooling (you can do this too), but you have to tidy up your home and get it conducive for learning. It’ll help if you get a bit creative using anchor charts, posters, art & crafts, etc. You can learn to make a quick and easy chart here. […]